Data Visualization
Application to visualize time-series data in intdash
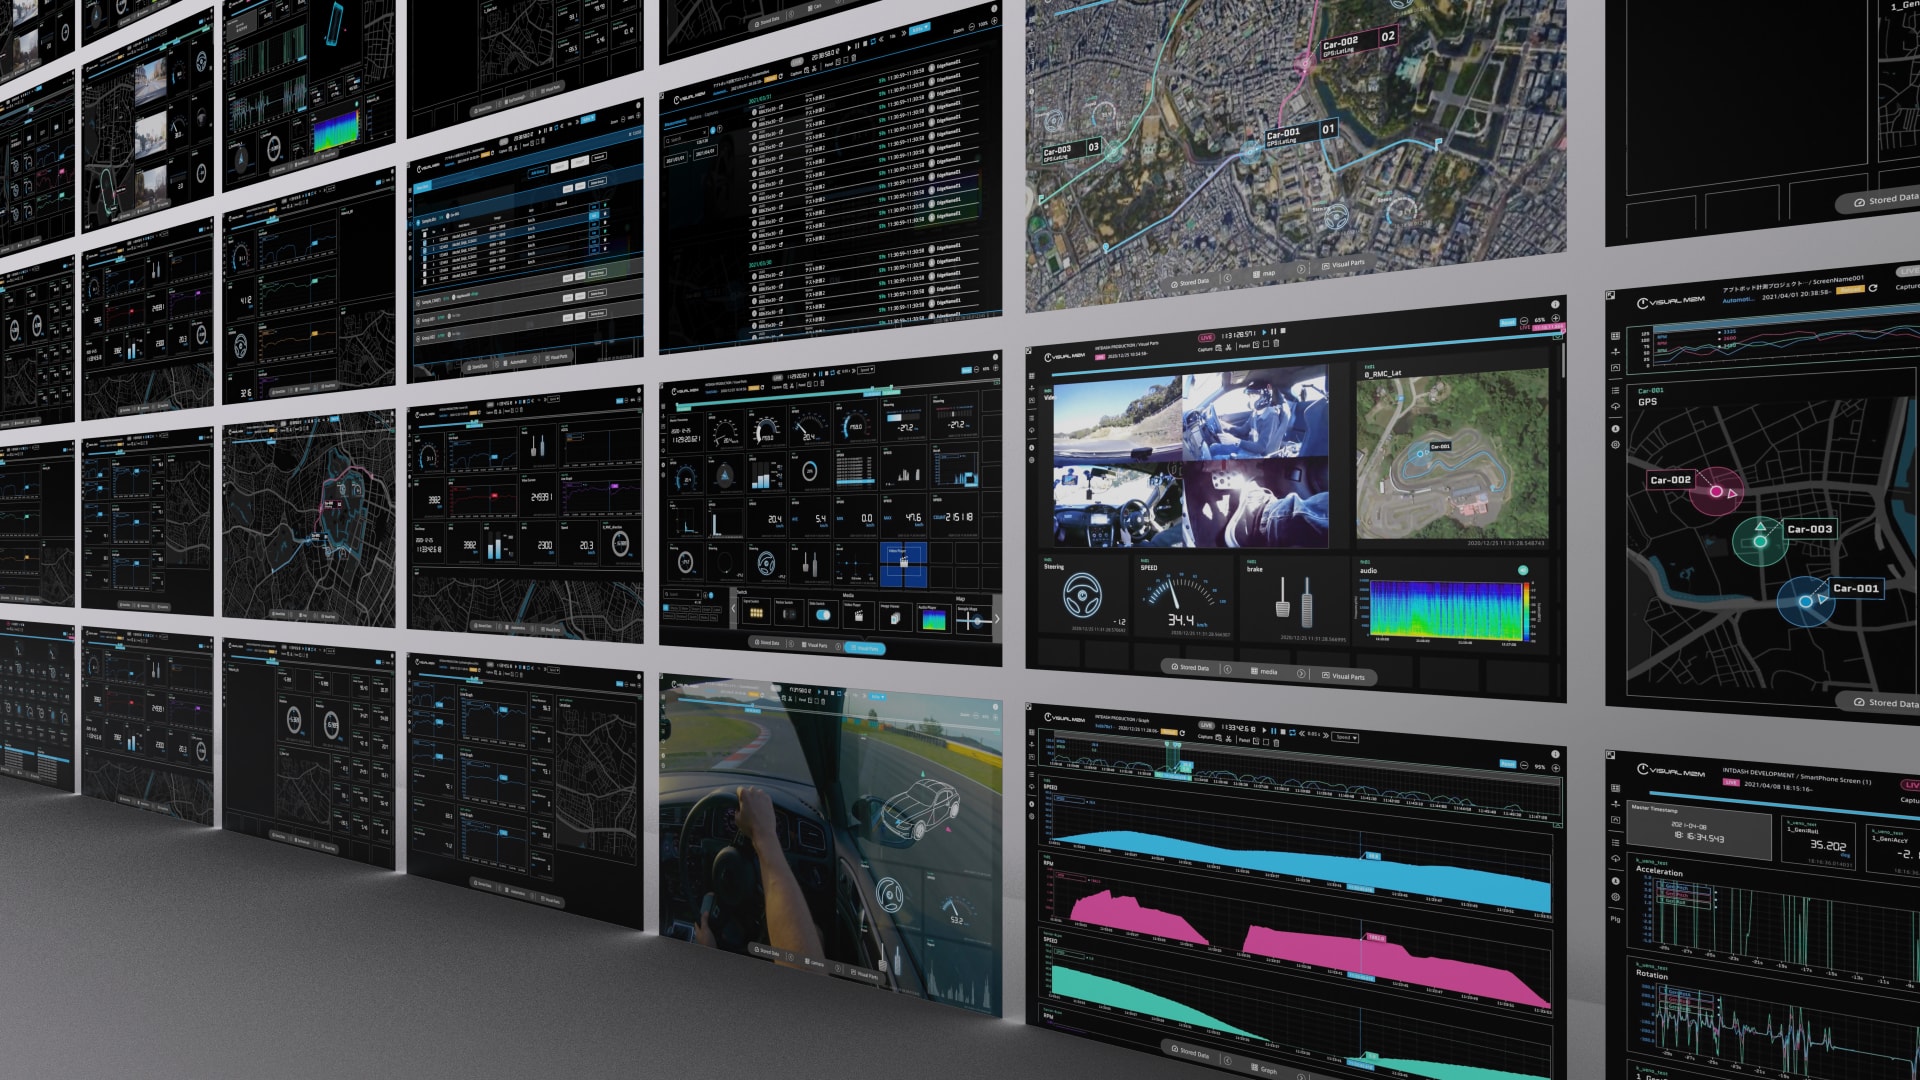
Visual M2M Data Visualizer
Visual M2M Data Visualizer is a web-based dashboard application that visualizes real-time streaming in the intdash data pipeline or past measurement data accumulated on the platform. The user can create a dashboard with intuitive operation by binding data and parts on the panel.
Beautiful visualization with intuitive operation anywhere with a browser
A browser-based multifunctional user interface provides stream display of real-time data, graph display of stored data, versatile visualization of time-series data, and CSV format download function. The user can easily create a dashboard and visualize data from various angles with intuitive drag & drop operation.
Support for various representations of time-series data
Visual M2M Data Visualizer provides various visualizations such as simple text display, beautiful meters and graphs, maps with GPS tracking, video, and audio visualization. Simple data analysis is also possible by displaying average values, maximum values, and graphs.
- Graph display along the timeline
- Real-time statistics display (such as histograms and scatter diagrams)
- Data tagging and searching
- GPS data mapping
- Playback and visualization of video and audio
- Data display with 2D or 3D models
Playback and visualization of video and audio
Time-series data including control signals and sensor signals, video, image, and audio data can be replayed. Simultaneous display of synchronized data enables integrated visualization of fusion data.
Flexible comparison display of multiple devices and multiple data types
You can easily compare and analyze data from multiple devices by binding data onto the same dashboard. Data Visualizer can also be used for real-time fleet monitoring by displaying multiple devices at the same time.
Automatically managed time-series data and easy data access
All stored data accumulated in the time-series database can be easily called from the list. Stored data is automatically sorted by the acquisition time. You can load an entire measurement data set or load partial data by specifying the start and end times. You can quickly access desired data by adding a tag to any time point.
Binary data conversion
You can convert binary format messages, such as CAN data fields, into physical values, such as numerical values and flag values, by loading the data definition file prepared in advance. You can also download data converted into physical values to your PC as a CSV file.